OCTO:Open Core for Technology Orchestration/TDOMS/Analytics/User Defined Charts
User Defined Charts
You can insert records programmatically into the OMDSH table using the Access Client SQL function. The Remain team created a simple maintenance function for the Dashboard file, which can be downloaded here:
File:Dash.jar - This requires a Java VM to be installed. Run with 'java -jar Dash.jar'
The analytics view displays charts based on the queries defined on the file OMDSH.
OMDSH contains the following fields:
- SHUUID: Universal Unique ID
- SHDESC: Description
- SHCATC: Category
- SHCHTT: Chart Type
- SHCOLN: Number of columns
- SHCOTA: Column type array
- SHMAXN: Maximum
- SHMINN: Minimum
- SHSQLD: SQL Definition
Chart Types
The field SHCHTT is a number(1,2,3,4,5,6) that represents the following chart types:
- 1: BarChart
- 2: PieChart
- 3: GroupedBarChart
- 4: StackedBarChart
- 5: TrendComboChart
- 6: TargetLineBarChart
Column Types
The field SHCOTA represents the column Series types. The following types can be used as elements of the column array:
- (1) Domain: the domain column of the chart series.
- (2) Value: The appropriate value of the domain.
- (3) Trend: indicates a line superimposed on a chart revealing the overall direction of the data.
Number of Columns
The field SHCOLN represents the number of columns retrieved from the query result. The number of columns must equal to the column types.
Category
The field SHCATC represents the category name given by the user.
Maximum
The field SHMAXN represents the maximum value defined by the user to indicate warnings in the charts.
Minimum
The field SHMINN represents the minimum value defined by the user to indicate warnings in the charts.
SQL Definition
The field SHSQLD represents the query to be used as data for the chart.
Description
The field SHDESC represents the description of the query.
Example
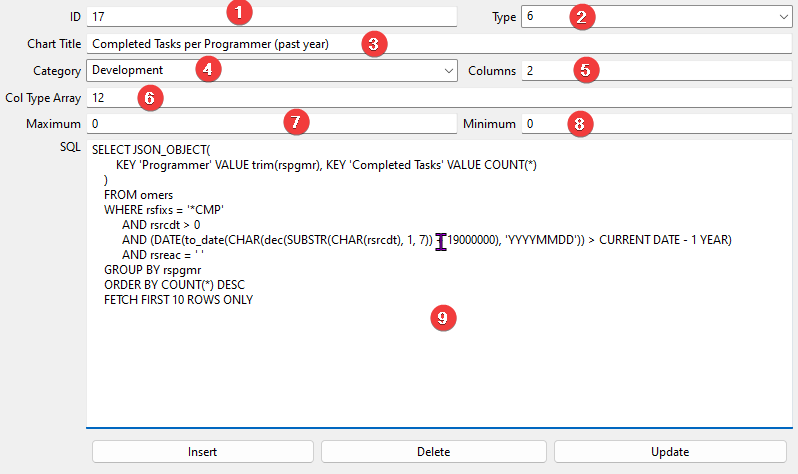
The following data is retrieved from the OMDSH file using the Dash.jar program.
The result of the query can be something like this:
 {"Programmer":"SHUKS","Completed Tasks":12}
 {"Programmer":"YADAN","Completed Tasks":4}
 {"Programmer":"MISHD","Completed Tasks":3}
 {"Programmer":"WIM","Completed Tasks":3}
In this case, we see four rows of two columns.
- The Unique ID
- The type. In this case 6
@TODO
