GR:Gravity/Web/Analytics
Analytics from a workmangement filter
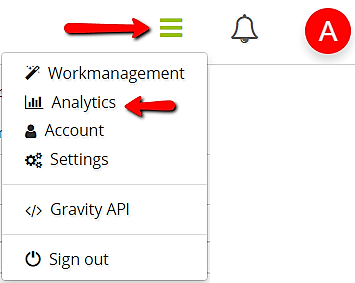
To visualize a workmanagement filter in analytics, just hover over it then click the (as shown above) icon. You'll be then redirected automatically to the analytics section where this selected filter is depicted.
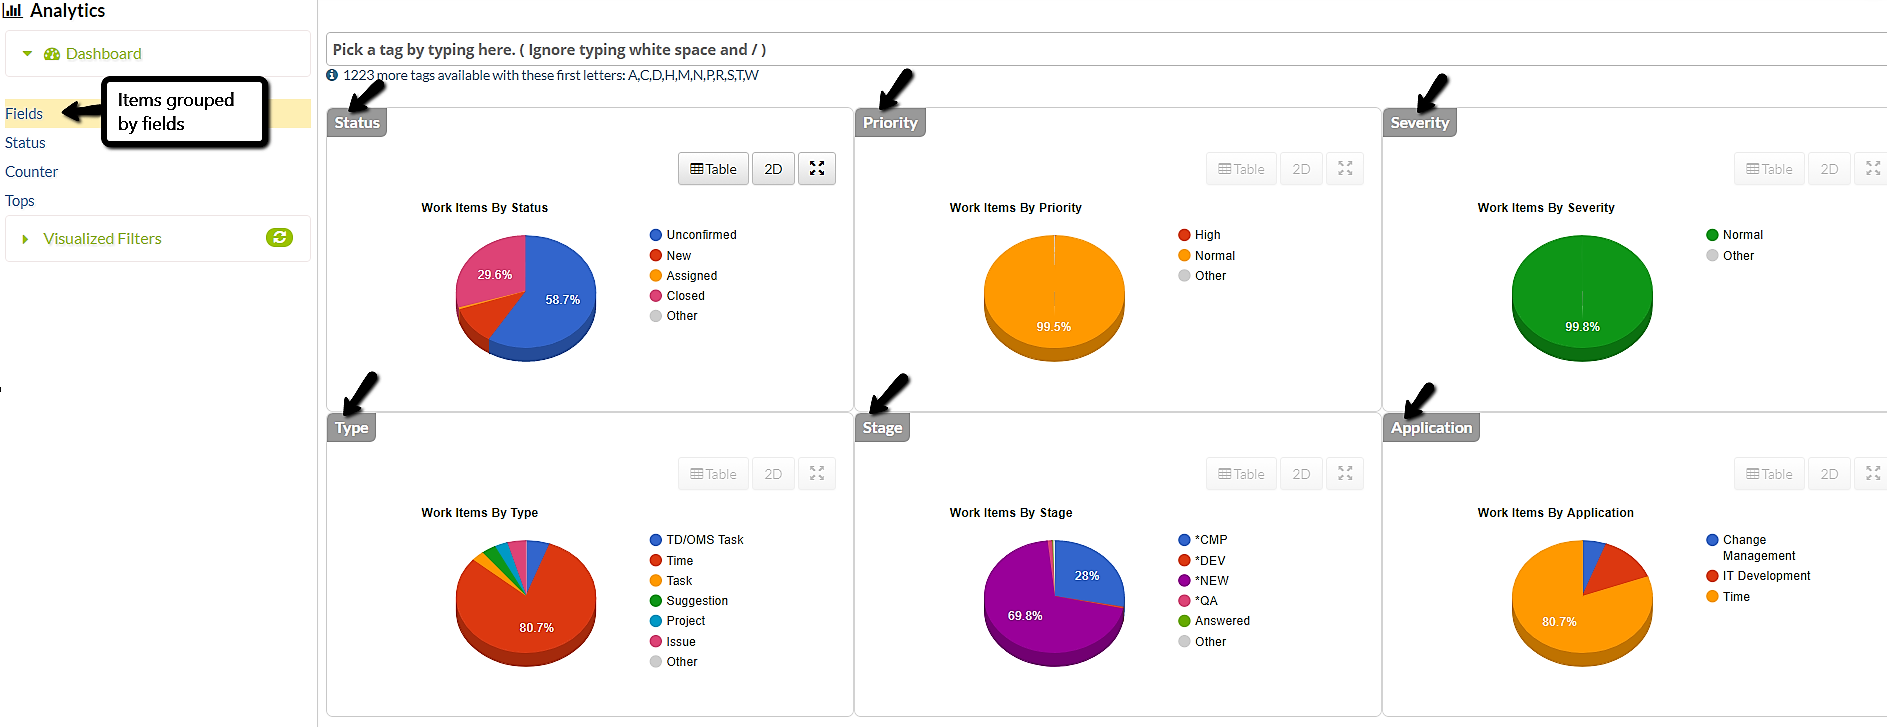
Fields
This part of analytics groups and depicts items by the following fields: Status, Priority, Severity, Type, Stage and Application.
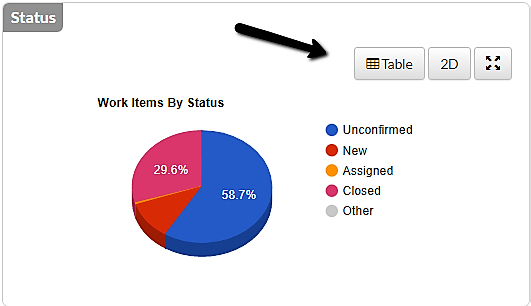
Each field section has its own menu. Hover over to view it.
Status
This part of analytics shows statuses of work items in three tabs.
- First tab depicts all work items that have been closed, resolved or verified.
- Second tab depicts all items having an overdue expected completion date.
- Third tab depicts all work items with missed expected start dates.
Counter
This section of analytics shows some global Gravity counts grouped in tabs:
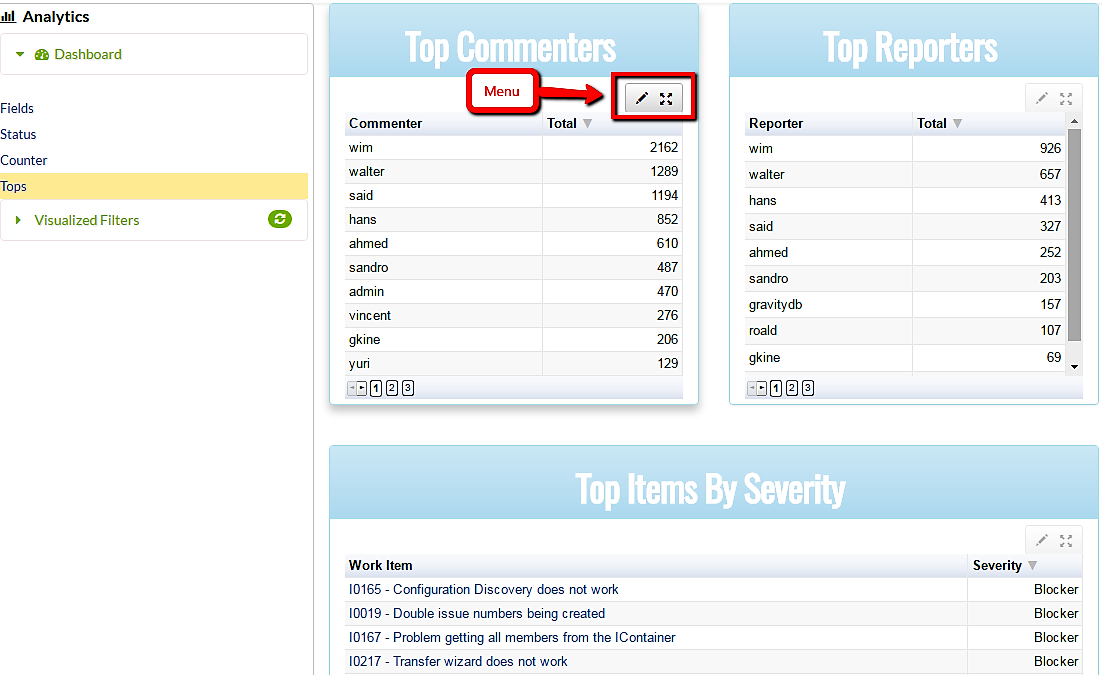
Tops
This part of analytics shows top commenters, reporters, assignees, resolvers and items with highest severity or priority.
Visualized filters
A filter (same filters you have in the work-management page) can have its content (work items) visualized in this part of analytics. That is, all (but only) work items within the selected filter are grouped by the following fields: Status, Priority, Severity, Type, Stage and Application. Same as in the Fields section except that all items in this case belong to the selected filter. See Fields:
Tags
You can use tags to tune the data being depicted. A tags input field will appear on the top when relevant.
Tip: when typing in the tags field, you may want to ignore typing white spaces and / (backslash). Example: typing statusc will show Status / Closed and typing severitym will show Severity / Major and Severity / Minor as suggestions, and so on.


